How fair is a "fair" exam? An exploratory study of baccalaureate results and candidate profiles


Abstract
With this study, I aimed to understand whether or not Baccalaureate results could be impacted by factors other than subject matter expertise. I analysed over 136,091 entries and found that:
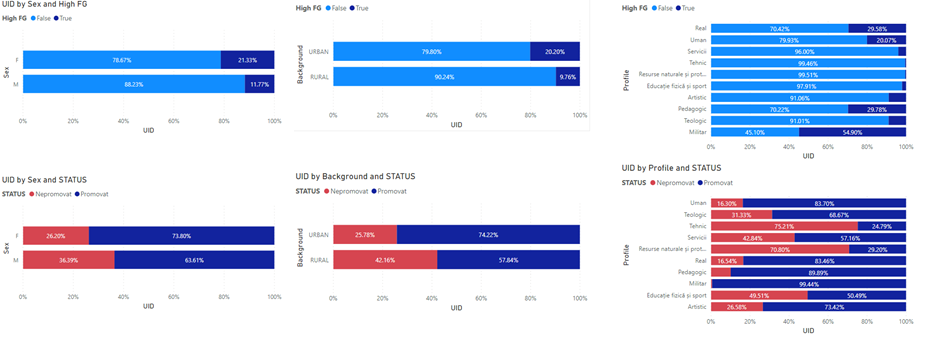
- Females are approximately twice more likely than males to achieve high Pass marks (22.33% vs 11.77%)
- Males are approximately 1.4 more likely to Fail the exam (36.39% vs 26.20)
- Rural candidates are twice more likely to Fail the exam than urban candidates (42.16% vs 25%)
- Urban candidates are over twice more likely to achieve high Pass marks (20.20% vs 9.76%)
- Choices of candidates regarding the academic profile and test subject/ topic seem to significantly influence the distribution of results
- Demographics, background and academic choices seem to be a good indicator of Baccalaureate success of candidates – I was able to achieve a 93% accuracy in predicting Pass/ Fail exam outcomes based on these variables. This is exceptionally high, given it was achieved without looking at any individual past academic performance.
My research is limited by the sample available (discussed further), the sophistication of research methods used, and inability to perform any experiments which would have shed light on any causal links between the variables discussed (beyond the correlative relationships described in this paper)
Therefore, further research is required the understand the underlying cause behind these observations. As the Baccalaureate is designed to be an exam fair for all and is supposed to offer a standardised scale regardless of background or academic subject choices, I suggest my findings could be used to improve the quality of how the Baccalaureate is deployed in the years to come. Lastly, the findings could also shed light not just on the Baccalaureate, but a deeper underlying problem with the way education is approached and received across the country.

Motivation – towards exams fair for all
The Baccalaureate (the final high-school exam) is designed to be a great equaliser, applying a uniform assessment at national level to offer an impartial, unbiased, standardised view of the true level of knowledge of students against the topics and academic profiles they have chose to specialise in. The results of the Baccalaureate have great implications in the life of young graduates – all Universities ask for the final marks as well as all employers, therefore its accuracy and impartiality is essential.
In my exploratory research, I used a set of over 130,000 anonymised Baccalaureate results (Pass/ Fail, final marks) and candidate demographic data (location, subject choice, age, location, etc.) to determine to what extend the exam is truly impartial, fit-for-purpose and fair – i.e. is the distribution of results similar across inherit student demographics, circumstances and subject choices (these factors should be irrelevant, therefore no impact should be observed in the distribution of results).
Research Questions
In trying to understand more about the fairness of the Baccalaureate, I took a systematic approach starting with exploratory questions, all the way to a descriptive model with predictive power. My research journey aligns to the following 4 questions:
A. Are there any significant abnormalities in the overall distribution of final grade results?
B. Do candidate demographics (i.e. sex and urban/ rural background) and academic choices (e.g. profile) impact their probabilistic outcomes through different final grade result distribution?
C. Are all choices for Test C and Test D equally capable of placing candidates on a standardised knowledge distribution?
D. Can we predict candidate success by analysing demographics, academic choices, circumstances and peer data?
I have attempted to answer each of these individually in my Findings section below.
Dataset
This research exercise uses a sanitised version of Baccalaureate results data, publicly available for download from here. The data consists of a table containing 136,091 entries. Each entry spans at most 52 columns and represents a Baccalaureate candidate – some columns are left blanks, sometimes by omission, other times on purpose (e.g. when a candidate failed one of the exam assessments early on and chose to not attend the subsequent tests, there will be no final mark calculated). Out of the 52 columns of data and metadata, I have selected a number of key elements for my analysis, per the header below:
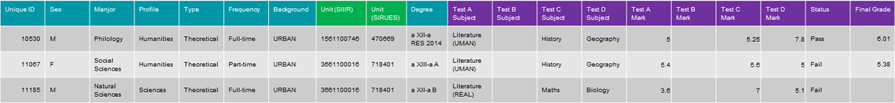
The blue columns provide information about the candidate (e.g. urban/ rural, sex, attendance type, year of graduation, exam and academic choices), the green columns provide information about the school/ institution (i.e. its unique identifiers), and purple columns provide information about the exam itself (e.g. the various test/ topic options selected by the candidate, Pass/ Fail status, and final grade where applicable). The columns I left out include interim exam results, additional tests which do not contribute to the final mark, number of appeals and their outcomes, as well as additional metadata on the actual data collection. These data points would be irrelevant for my analysis and scope.
All exam grades/ marks (including individual test marks and the Final Grade) must range between 1 (minimum) and 10 (perfect score), although the data shows a range of -2 to 10, which will require cleaning. Test A and Test B are dependant on each other – candidates get to choose one of the two, therefore there will be mutually exclusive blanks. The Pass status is determined by completion of all Tests with an individual grade/ mark of equal or above 5, as well as an overall average of marks equal or above 6.
Note: As explained in the “Data Preparation” section, I translated the data columns and headers above to make it easier for you to follow along – the original values are in a different language, but the structure is intact.
Data preparation and cleaning
Upon importing the raw data and progressively exploring the contents (using Pandas’ functionality such as shape, describe and info), I conducted a number of operations to prepare the data frame for analysis:
At the onset, I removed all unnecessary columns, to help me focus on relevant information and speed up the processing (this step alone reduced the number of values from 7,076,732 to 1,905,274). This was done by targeting the desired selection of columns with a separate Pandas data frame reference. I translated the column names into English, to make it easier to present my result and help you follow me on my journey – this I did by assigning new values to dataframe.columns.
For data validation, I confirmed all relevant non-numeric values in my columns contained only what I expected (using Pandas’ unique method to query the data) – I could find no gaps or errors in these field. However, when looking at the number ranges, I discovered some erroneously went below 1 (which is the minimum possible mark in the exam). After looking into the affected rows, I found that these corresponded to candidates who were absent or eliminated from the exam. As all my research questions are focused on the actual exam results (and not on attendance trends), I sanitised these rows out from the analysis (using a series of Pandas data frame masks) – this step also addressed the negative marks issue which I confirmed with Pandas’ describe method. At the end of this step, my observational pool consisted of 129,084 clean rows (from the original 136,091).
One extra column was required to add a High Final Grade flag. I did this by using Pandas’ vectorisation functionality, and set the threshold above the 90th scoring percentile (i.e if the final grade is 9 or above, I classified it as a High Grade – this was achieved only by 16% of the students).
For the machine learning algorithm, a further step was required to reduce the categorical data to numeric values, without introducing collinearity or ranking. This was achieved with the used of Pandas’ get_dummies method.
Note that I created additional masks for each individual exercise as needed (e.g. while missing Final Grade values is not a gap in the data but one of its features, dropping the rows missing Final Grades was necessary to assess the distribution of Pass candidate marks).
Methodology
I used an array of methods when answering my research questions, as outlined below:
A. Are there any significant abnormalities in the overall distribution of final grade results?
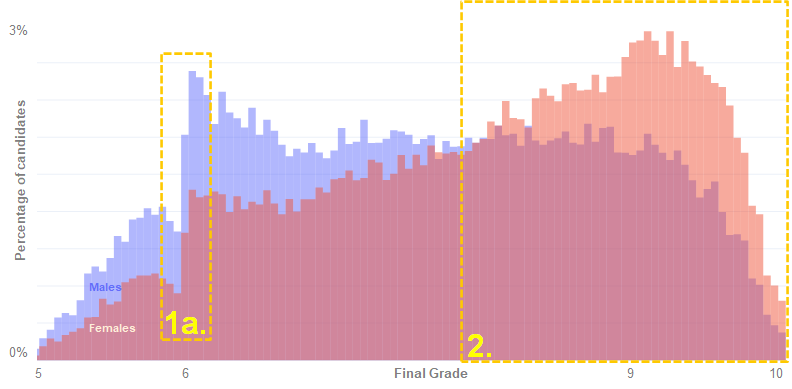
This initial exploratory question relied on effective visualisation of the data. For this purpose, I used Python’s Plotly module. From here, I chose overlaid histograms as the most honest and relevant way of mapping the data to be able to show and understand the distribution of grades.
B. Do candidate demographics (i.e. sex and urban/ rural background) and academic choices (e.g. profile) impact their probabilistic outcomes through different final grade result distribution?
For this research question, although the use of histograms was an effective and appealing way of presenting the content, the complexity of the data did not allow me to observe the finer insights. Therefore, I also used a number of normalised bar charts (which I added to the appendix for reference) to help me visualise and control for different percentage splits in data. These were also designed in Plotly.
C. Are all choices for Test C and Test D equally capable of placing candidates on a standardised knowledge distribution?
This research question require a similar approach as question B. above. I used a different set of histograms and bar charts to answer it. I chose to sanitise out Test A and Test B results because there was no candidate choice there – all candidates have to take Language and Literature in their native tongue.
D. Can we predict candidate success by analysing demographics, academic choices, circumstances and peer data?
Many of my independent variables were categorical and Sklearn algorithms only work with numerical inputs. Therefore, the first step was to fit and transform the data onto numerical scales without introducing unwanted ranking and collinearity (which would have decreased the accuracy of my model). To achieve this, I used Pandas’ get_dummies method on my data frame, with the following extra arguments: theprefix_sep=’_’,drop_first=True.
I then split my data into training and testing random samples with a ratio of 2:1, using Sklearn’s train_test_split function. I chose the Decision Tree Classifier of Sklearn as my supervised machine learning method because my goal was to predict a target variable (i.e. Pass/ Fail status) by decision rules inferred from the data features (i.e. demographic and background candidate information). To test the accuracy of my model, I used Sklearn’s accuracy_score, to compare the expected and predicted outcomes.
Findings and discussion
A. Are there any significant abnormalities in the overall distribution of final grade results? Yes.
Observation 1a. The first interesting finding is that the distribution breaks abruptly for the entire population just before the 6 mark when it comes to the overall average. With 6 being the minimum passing grade for the Baccalaureate, this abrupt break is unlikely to be accidental and could be the result of assessor sentiment (Yeates et al, 2013). As a borderline-fail would almost invariably give rise to a candidate appeals process, it is possible that assessors try to avoid this scenario and are reluctant to score an exam just below the passing threshold.
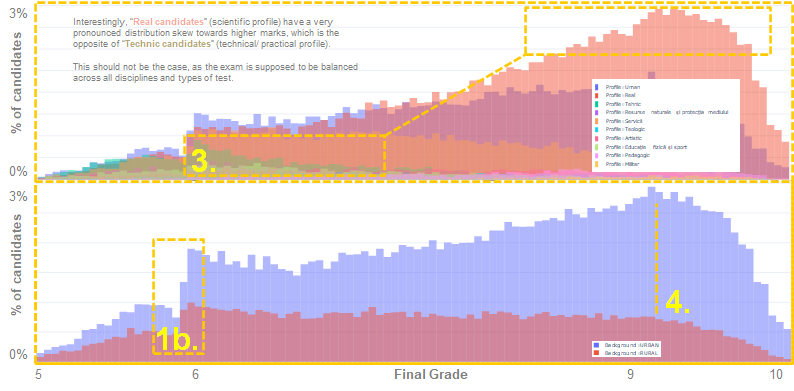
Observation 1b. Regardless of population split criteria, the distribution break around the pass mark threshold seems to hold consistently, supporting our first observation.
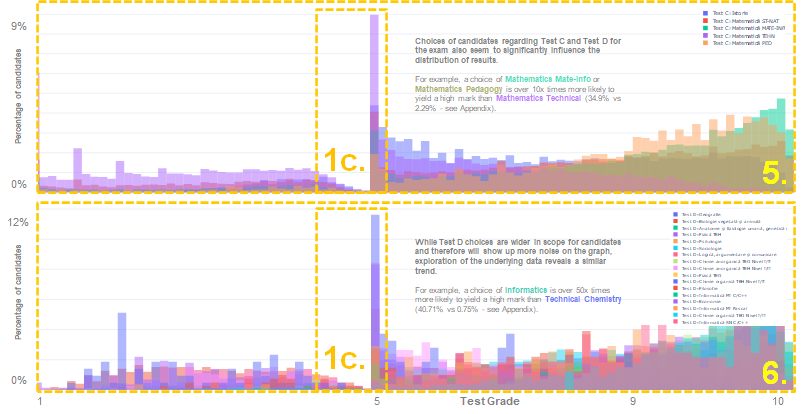
Observation 1c. For individual tests, the pass/ fail threshold for the Baccalaureate is at 5 (as opposed to 6 for the final grade) – therefore we see the now expected distribution break which coincides with this level. Interestingly, for individual tests, this is much more pronounced than its aggregated Baccalaureate-level version of the Pass gate observed before.
B. Do candidate demographics (i.e. sex and urban/ rural background) and academic choices (e.g. profile) impact their probabilistic outcomes through different final grade result distribution? – Yes – see 2, 3, 4.
Observation 2. Second obvious abnormality can be observed in the high final grades range. The distribution curve (see above) is evidently different for females (sloping upwards when approaching 9 and higher grades) as opposed to males where the opposite is true (more weight in the lower grades), suggesting a significantly higher proportion of females achieve higher marks than males.
Indeed, the Baccalaureate data shows that when it comes to high marks, females are two times more likely to achieve a score above 9 than males are (22.33% vs 11.77% – see Appendix). This finding is aligned to current research which suggests females, on average, tend to achieve higher scores than males in exams that require high concentration over long periods of time, given the same level of subject knowledge and IQ (Balart and Oosterveen, 2019).
Observation 3. Choices of candidates regarding academic profile (e.g. humanities, sciences, technical, arts, etc.) seem to significantly influence the distribution of results, as highlighted in the second illustration above. Exam success differs across academic profiles significantly. This is echoed by the Pass/ Fail probability, as well as the likelihood of achieving high marks. For example, pedagogic candidates are 7x times less likely to fail than technically aligned candidates (10.11% vs 75.21% – see Appendix).
Observation 4. Interestingly, the rural/ urban context also seems to have a meaningful impact on the distribution of final marks, suggesting that, overall, urban candidates are more likely to score higher. This is particularly striking when looking at failure rates and high mark achievements. Rural candidates are twice more likely to fail the exam than urban candidates (42.16% vs 25%). Furthermore, urban candidates are over twice more likely to achieve high marks (20.20% vs 9.76% – see Appendix).
C. Are all choices for Test C and Test D equally capable of placing candidates on a standardised knowledge distribution? No – see 5,6.
Observation 5. Choices of candidates regarding Test C and Test D for the exam also seem to significantly influence the distribution of results. For example, a choice of Mathematics Mate-Info or Mathematics Pedagogy is over 10x times more likely to yield a high mark than Mathematics Technical (34.9% vs 2.29% – see Appendix).
Observation 6. While Test D choices are wider in scope for candidates and therefore will show up more noise on the graph, exploration of the underlying data reveals a similar trend. For example, a choice of Informatics is over 50x times more likely to yield a high mark than Technical Chemistry (40.71% vs 0.75% – see Appendix).
D. Can we predict candidate success by analysing demographics, academic choices, circumstances and peer data?
Given all findings for questions A to C, there is a clear connection that links demographics & candidate choices to success in the Baccalaureate (either in the form of Passing or even a high grade). By applying all the insights we know so far, we can visualise the discrepancy of likely outcome for Passing the Baccalaureate based on demographics and choices alone (without knowing anything about actual competency and skills of candidates). As shown below, the difference in likelihood of Pass/ Fail caused by demographics alone can be significant, based on our data.
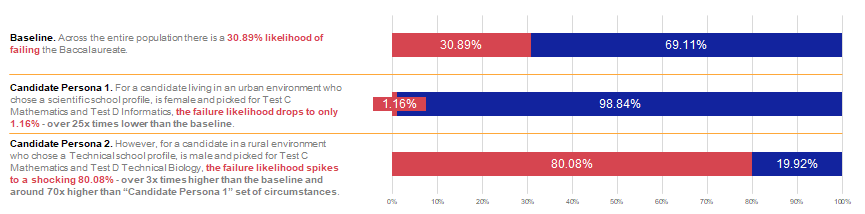
Across the entire population there is a 30.89% likelihood of failing the Baccalaureate. For a candidate living in an urban environment who chose a scientific school profile, is female and picked for Test C Mathematics and Test D Informatics, the failure likelihood drops to only 1.16% – over 25x times lower than the baseline.
However, for a candidate in a rural environment who chose a Technical school profile, is male and picked for Test C Mathematics and Test D Technical Biology, the failure likelihood spikes to a shocking 80.08% – over 3x times higher than the baseline and around 70x higher than “Candidate Persona 1” set of circumstances.
Based on the information accumulated so far, it seems that the Baccalaureate success could be linked to factors other than subject matter expertise. While correlation does not demonstrate a causal link, the variables with an impact on the result could be used to train a machine learning predictive model and assess the likelihood of a Pass or a Fail, as well as a high mark.
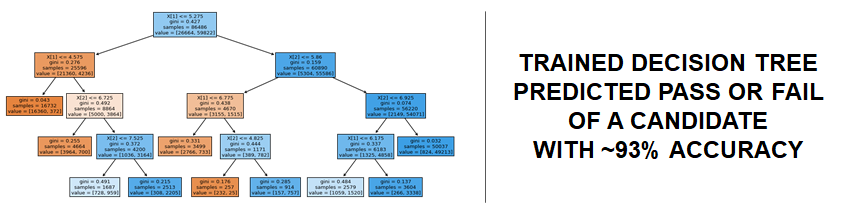
As demographics, background, unit and academic choices seem to be a good indicator of Baccalaureate success of candidates, I took these data points and used it to train a decision tree. A preparatory step to be able to do this was to encode the data from categorical to numeric, while avoiding introducing and ranking and perfectly collinear variables. I achieved this with Pandas’ get_dummies method.
I split the data into a random sample of training data (2/3) and testing data (1/3). The features of the model included all the variables discussed so far (‘Sex’, ‘Major’, ‘Profile’, ‘Type’, ‘Frequency’, ‘Background’, ‘Unit’, ‘Test C’, ‘Test D’, ‘Test C Mark’, ‘Test D Mark’). What I tried to predict was whether on not the candidate was going to pass or fail the Baccalaureate.
I found that we could indeed do this, with a very high degree of accuracy – at around 93%. On this slide I included a visual representation of the decision tree classifier I trained and used. For this render I used Sklearn’s plot_tree method.
Although the model is not perfect, it illustrates the impact of demographics, background, and choices on exam success, casting a shadow of doubt on the exam’s universal assessment of knowledge alone. Further analysis and experiments could be carried out to assess the true scale of the issue (e.g. trailing new methods of testing to bridge the gender performance gap as well as the urban to rural divide, as well as a review of the relative difficulty of topics chosen). This will likely improve the fairness of the exam in the years to come.
Limitations
The findings can only establish correlation links – however, I am not able to test for causation, which would be the natural next research step. Although the literature suggests that examination methods can themselves skew results (Yeates et al, 2013), the observations here might not be entirely stemming out of Baccalaureate inefficiencies. Instead, these might be residual echoes of a deeper underlying problem of education engagement – the Baccalaureate results might only be a symptom of that.
While my sample was complete, I only had access to observations from one year – therefore, the findings might be different if the pool of observations would cover a wider time period to sanitise away any non-systemic characteristics of 2019.
The findings are based only on Baccalaureate data and, therefore, it would not be appropriate to extrapolate their impact on any other forms of examination.
The academic scope of this research, my knowledge of advanced analytics and statistics was a limiting factor. Although I studied and tested ways to gather insights from data, professional statisticians and data scientists might be able to further refine and enrich the findings I presented here.
Conclusions
With this study, I aimed to understand whether or not baccalaureate results could be impacted by factors other than subject matter expertise. Surprisingly, my findings suggest that results’ distribution and overall exam success can indeed be linked and, more importantly, inferred from candidates’ profiles. I analysed over 136,091 entries and found that:
A. Are there any significant abnormalities in the overall distribution of final grade results?
Yes. The first interesting finding is that the distribution breaks abruptly for the entire population just before the 6 mark. With 6 being the minimum passing grade for the Baccalaureate, this abrupt break is unlikely to be accidental and could be the result of assessor sentiment.
B. Do candidate demographics (i.e. sex and urban/ rural background) and academic choices (i.e. profile) impact their probabilistic outcomes through different final grade result distribution?
Yes. The distribution curve is evidently different for females (sloping upwards when approaching 9) as opposed to male where the opposite is true (higher proportion in the lower grades), suggesting a significantly higher proportion of females achieving high marks than males. Choices of candidates regarding academic profile (e.g. humanities, sciences, technical, arts, etc.),as well as urban/ rural split seem to also significantly influence the distribution of results.
C. Are all choices for Test C and Test D equally capable of placing candidates on a standardised knowledge distribution?
No. Choices of candidates regarding Test C and Test D for the exam also seem to significantly influence the distribution of results.
D. Can we predict candidate success by analysing demographics, academic choices, circumstances and peer data?
Yes. Candidate demographics, background, unit and academic choices seem to be a good indicator of Baccalaureate success of candidates. Inferring from these variables alone (no information on prior candidate performance or subject knowledge), I found that we could predict Baccalaureate success with a very high degree of accuracy – at around 93%.
The findings were unexpected. I anticipated the exam results to be distributed uniformly across males/ females, urban/ rural, as well as across different tests and academic subjects – the level of difficulty and approach of the exam is supposed to be designed so that, overall, only true subject matter expertise shows as in the results. My findings made me question the fairness of the examination approach and made me wonder what are the root causes of biased outcomes.
My research is limited by the sample I had available, the sophistication of research methods, and inability to perform any experiments which would have shed light on any causal links between the variables discussed (beyond the correlative relationships described in this paper). Therefore, further research is required the understand the underlying cause behind these observations. As the Baccalaureate is designed to be an exam fair for all and is supposed to offer a standardised scale regardless of background or academic subject choices, I suggest my findings could be used to improve the quality of how the Baccalaureate is deployed in the years to come. Lastly, the findings could also shed light not just on the Baccalaureate, but a deeper underlying problem with the way education is approached and received across the country.
Acknowledgements
I am grateful for the conversations on data visualisation principles and argument building that I had with Lorna. While these were general and not specific to this exercise, they had a positive impact on how I layered and organised my arguments.
I am grateful to those readers who took the time and effort to not just understand this research, but also to write me feedback and helped me improve this reviewer who took the time and effort to understand this piece of research and score it – thank you!
References
- Courses.edx.org. (2019). Course | DSE200x | edX. [online] Available at: https://courses.edx.org/courses/course-v1:UCSanDiegoX+DSE200x+3T2019/course/ [Accessed 14 Oct. 2019].
- Pandas.pydata.org. (2019). Pandas 0.25.2 documentation. [online] Available at: https://pandas.pydata.org/pandas-docs/stable/ [Accessed 20 Oct. 2019].
- Plot.ly. (2019). Plotly chart attribute reference. [online] Available at: https://plot.ly/python/reference/ [Accessed 20 Oct. 2019].
- Stack Overflow. (2019) Stack Overflow – Where Developers Learn, Share, & Build Careers. [online] Available at: https://stackoverflow.com/ [Accessed 20 Oct. 2019].
- Balart, P. and Oosterveen, M. (2019). Females show more sustained performance during test-taking than males. Nature Communications, 10(1).
- Data.gov.ro. (2019). Rezultate Bacalaureat Sesiunea I 2019 – Rezultate Bacalaureat Sesiunea I 2019 – data.gov.ro. [online] Available at: http://data.gov.ro/dataset/rezultate-bacalaureat-sesiunea-i-2019/resource/3ea1d1d9-4dc8-4f85-a761-815730b33c15 [Accessed 16 Dec. 2019].
- Scikit-learn.org. (2019). User guide: contents — scikit-learn 0.22 documentation. [online] Available at: https://scikit-learn.org/stable/user_guide.html [Accessed 16 Dec. 2019].
- Yeates, P., O’Neill, P., Mann, K. and W Eva, K. (2013). ‘You’re certainly relatively competent’: assessor bias due to recent experiences. Medical Education, 47(9), pp.910-922.
Appendix